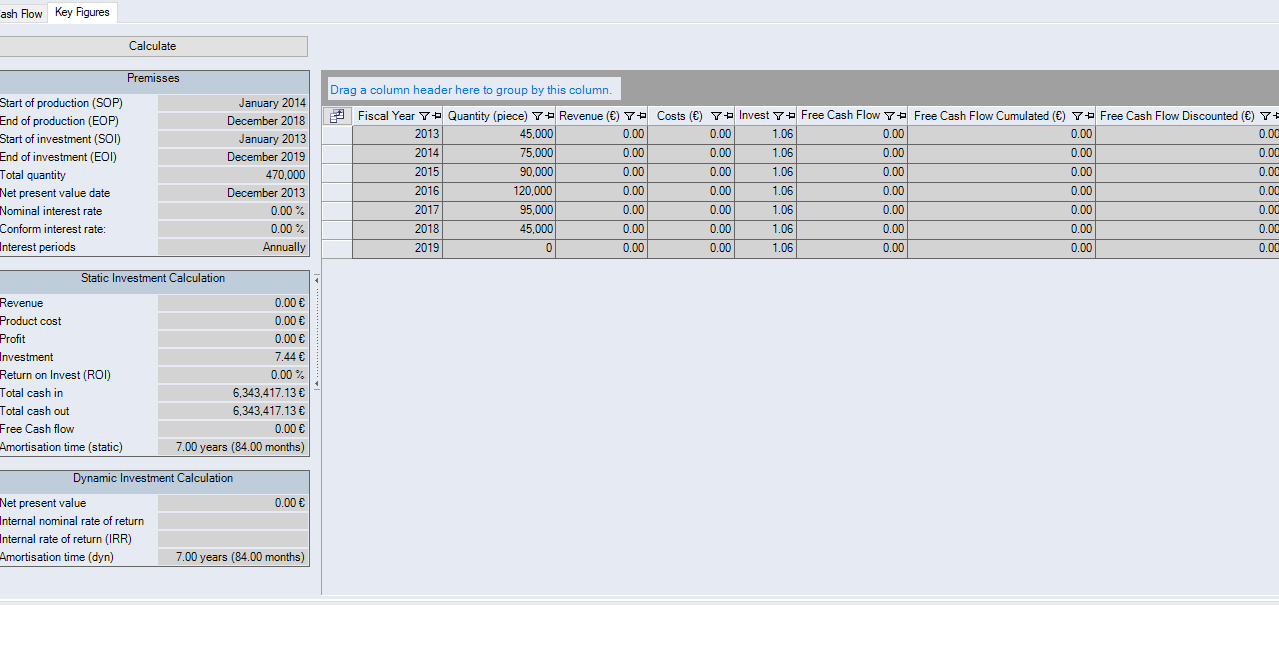
"Key Figures" tab

Static Investment Calculation
An amortization period under 0 is not shown. A line is shown instead.
| Legend | |
|---|---|
| D | Direct payments |
| E | Pay ins |
| I | Investment |
| k | Monthly product costs |
| P |
Number of periods: months from SOI until EOI |
| p | Monthly sales price |
| PUe | Average period overplus amount |
| q | Monthly quantity |
| T | Total periods |
| t | Periods |
| w | Weighting |
Dynamic Investment Calculation
| Key Figure | Description |
|---|---|
| Net present value | The net present value (capital value) is calculated based on the net present value and the period overplus amount which are discounted by the conform interest rate. No discount is made within the period that is directly defined by the net present value. |
| Internal nominal interest rate | The internal interest rate is the interest for which the capital value is 0. Monthly and annual interest periods are considered. |
| Internal rate of return (IRR) | The internal rate of return is a discount rate that makes the net present value of all cash flows equal to zero. |
| Dynamic amortization | The dynamic amortization period equals the number of periods from SOI until the present value is 0 or until the cumulated overplus amount of periods change from negative to positive. |
Table for Key Figures and Cash Flow
The multi-level table comprises all key figure and cash flow data of the individual projects. The table is equal to the table in the Batch Data Administration > Table of projects (level 1).