You need full access rights to the "Capital Efficiency Analysis" function to see the "Investments" category.
The Investments category allows you to distribute the project costs evenly across multiple project years or additional costs.
Open "Investments" Category
-
 Open the "Project Cockpit" dialog.
- Open a project.
- In the ribbon, click on File > Project Cockpit
 .
.
- Switch to the "Investments" category.
Settings
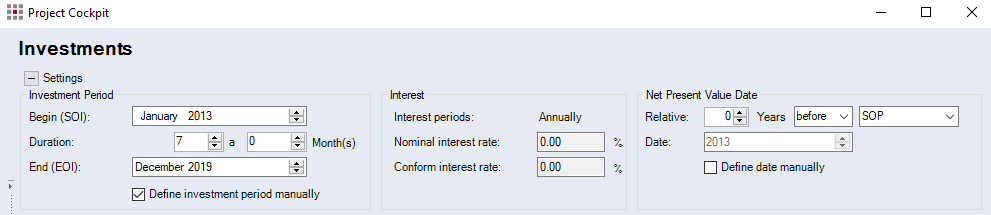
"Investment Period" group
-
"Begin (SOI)" date combobox
Enter the month and the year in which the investment begins.
-
"Duration" date comboboxes
Enter the investment period in years (a) or months. The investment end date (EOI) is automatically set according to the entered duration. The application ensures that the investment period is longer or equal to the production period.
-
"End (EOI)" date combobox
Enter the month and year in which the calculation ends.
-
"Define investment period manually" checkbox
The checkbox is only available, if the system settings allow you to overwrite the investment period manually.
"Interest" group
-
"Interest periods" display field
Display of the interest period in use. This is defined in the system settings and cannot be edited in the project. You can set monthly and annual interest periods.
-
"Nominal interest rate" entry field
Enter/display the annual interest rate on capital. The interest rate on capital is defined via an assigned location.
-
"Conform interest rate" entry field
Enter/display the conform interest rate. It is imputed from the nominal interest rate for monthly interest periods. The interest for monthly interest payment with the conform interest rate correspond to the interests for annual interest payment with a nominal interest rate.
Cash Flow tab
The "Cash Flow" tab is not available for the Multi project ![]() .
.
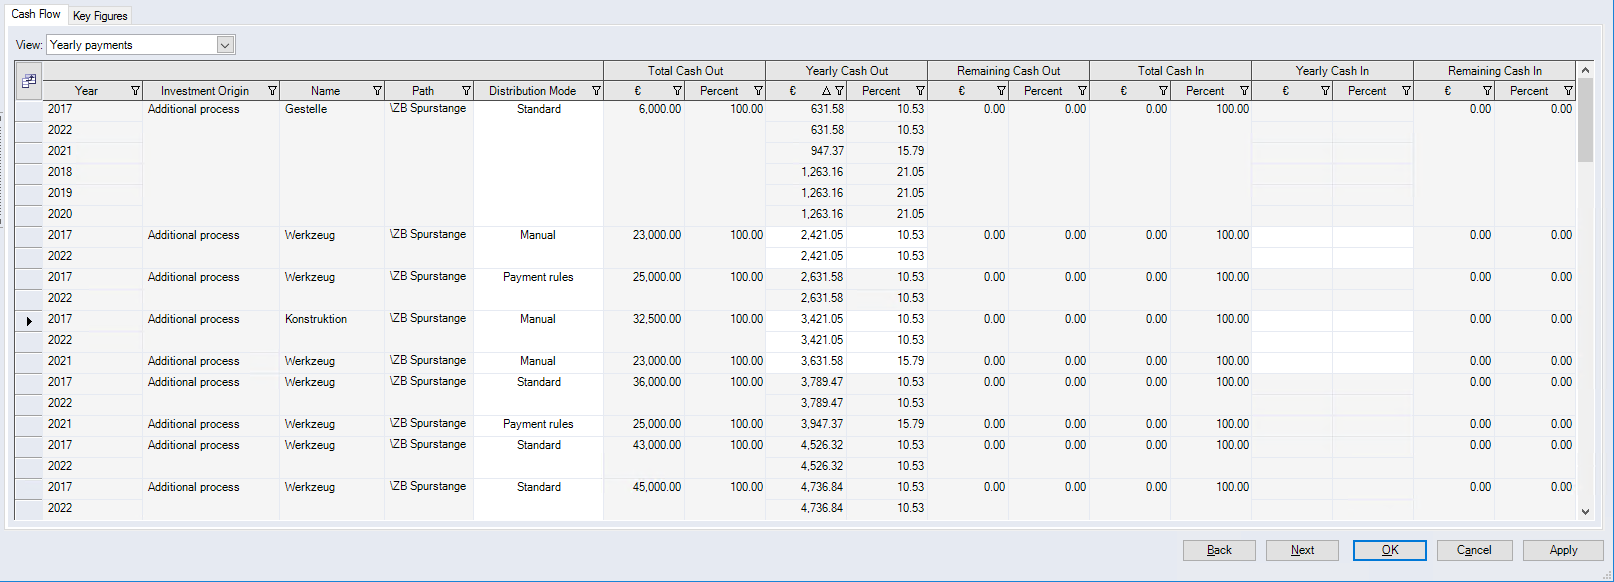
-
"View" combobox
Choose between 3 different views on the additional cost cash flow:
-
Investments
-
Yearly payments (default)
-
Monthly payments (only available for monthly investment periods)
-
-
"Column Selection" button

Click this button to open the "Field Chooser" dialog.
You can show or hide individual columns with additional values, provided that you have read permission on the values. The column selection is user-specifically saved. The attributes are hidden by default; they can be displayed but not edited.
| Column | Description |
|---|---|
| Year | Year in which pay ins and pay outs of the investment origin occur. |
| Investment Origin |
Shows the type of the investment origin.
A project-specific machine can only be selected if you have defined an option for the transfer of the machine investment (except for the "No coverage" option). Further Information > Machine Properties dialog, Investment Tab |
| Name | Name of the investment origin |
| Path | Path of investment origin in the project structure |
| Distribution Mode |
Selection of the cash flow course per investment origin The distribution mode determines how the cash flow is being distributed over the investment period/project period.
|
| Pay Out Rule |
Shows the name of the used pay out rule from the system settings. This column is initially hidden and can be unhidden via the Field Chooser Further Information see System Settings, "Payment Rules for Investments" group |
| Pay In Rule |
Shows the name of the used pay in rule from the system settings. This column is initially hidden and can be unhidden via the Field Chooser Further Information see System Settings, "Payment Rules for Investments" group |
|
Total Pay Out (Currency / %) |
Shows the sum of all pay outs. |
|
Yearly Pay Out (Currency / %) |
Shows pay outs per year. |
|
Pay Out Deviation (Currency / %) |
Shows the remaining pay outs available for distribution. |
|
Total Pay In (Currency / %) |
Shows the sum of all pay ins. |
|
Yearly Pay In (Currency / %) |
Shows pay ins per year. |
|
Pay In Deviation (Currency / %) |
Shows the remaining pay ins available for distribution. |
Additional columns in the Monthly payments view:
| Column | Description |
|---|---|
| Month | Month in which pay ins and pay outs of the investment origin occur. |
| Monthly Pay Out | Shows pay outs per month. |
| Monthly Pay In | Shows pay ins per month. |
Key Figures tab
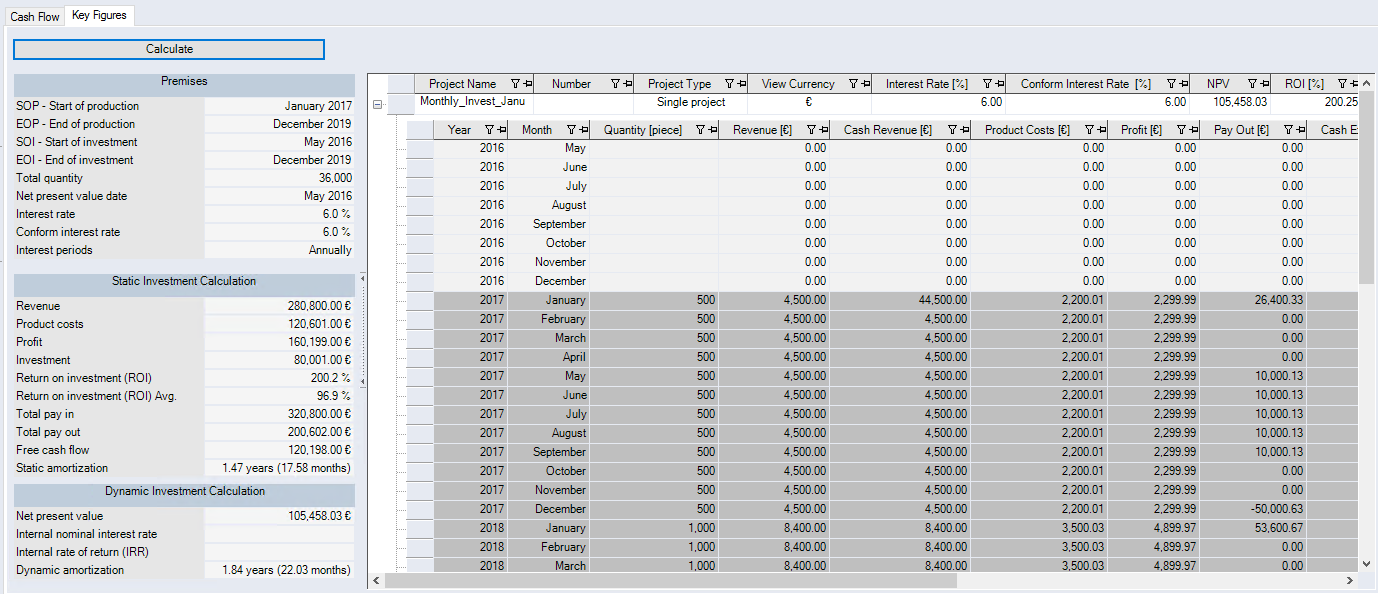
Static Investment Calculation


An amortization period under 0 is not shown. A line is shown instead.
| Legend | |
|---|---|
| D | Direct payments |
| E | Pay ins |
| I | Investment |
| k | Monthly product costs |
| P |
Number of periods: months from SOI until EOI |
| p | Monthly sales price |
| PUe | Average period overplus amount |
| q | Monthly quantity |
| T | Total periods |
| t | Periods |
| w | Weighting |
Dynamic Investment Calculation
| Key Figure | Description |
|---|---|
| Net present value | The net present value (capital value) is calculated based on the net present value and the period overplus amount which are discounted by the conform interest rate. No discount is made within the period that is directly defined by the net present value. |
| Internal nominal interest rate | The internal interest rate is the interest for which the capital value is 0. Monthly and annual interest periods are considered. |
| Internal rate of return (IRR) | The internal rate of return is a discount rate that makes the net present value of all cash flows equal to zero. |
| Dynamic amortization | The dynamic amortization period equals the number of periods from SOI until the present value is 0 or until the cumulated overplus amount of periods change from negative to positive. |
Table for Key Figures and Cash Flow
The multi-level table comprises all key figure and cash flow data of the individual projects. The table is equal to the table in the Batch Data Administration > Table of projects (level 1).